Strategic Overview
1. CXC® strategic objectives over the period under review remain:
- To strengthen our business model through diversification of our examinations portfolio, segment profile and geographic markets.
- To secure financial stability through sustainable revenue growth; increased efficiency and expense management.
- To deliver an enhanced stakeholder experience through investment in the right people, consistent use of technology and adherence to quality standards
2. In keeping with the strategic objectives, the Examinations Administration and Security Department (EAS) focused on activities to strengthen the product offering, reduce the cost of operations in the delivery of services to our stakeholders, improve customer services and contribute positively to the overall improvement of the Council’s operation.
Operational Efficiency
3. To improve e-Marking operations in 2018, CXC® expended resources on process review and staff training with EAS staff members being trained on the monitoring and support for e-Marking and e-Testing applications. Further, EC members were provided with a modular training program delivered on the Moodle platform. e-Testing was also expanded from Multiple Choice (MC) components only to include Essay and Short Answer components in the CSEC® May-June session.
4. Two members of the EAS team spent a week with the RM Operations team in the UK gaining a better understanding of the backend processes. The knowledge gained was shared with colleagues to help develop the support and monitoring capacity of the CXC EAS team.
JANUARY 2018 EXAMINATIONS
Registration
5. The January 2018 CSEC® Examinations recorded 15 percent increase in candidate and subject entries over 2017. The figure below shows the registration summary for the five years 2014-2018.
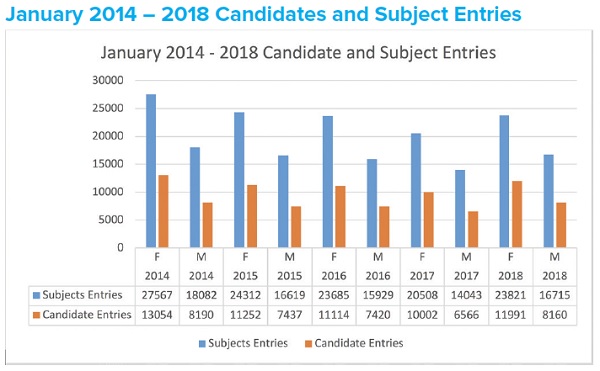
6. CSEC® Mathematic with 30.8% of the subject entries, CSEC® English A (26.8%) and CSEC® Social Studies (8.5%) were the leading subjects for the session. However, the science group showed the greatest year on year changes with CSEC® Biology having a 69% on the 2017 entries, CSEC® Physics (48%) and CSEC® Chemistry (43%) respectively.
e-Testing
7. In preparation for the January 2018 examination session, several online orientation and training workshops were delivered. This resulted in a relatively smooth operation during the live examinations. Only Multiple Choice (MC) Tests were offered in twelve of the thirteen CSEC® Subjects across seven (9) territories in this sitting with an 11% increase over the 2017 examination session. While the offline mode was available, all centres opted for the online modality.
11. To improve the quality assurance framework, the standardization setup time was extended and committees were given access to the question papers and mark schemes within one day of the examination being completed. This allowed for earlier preparation and finalization of the mark schemes.
12. In response to concerns raised by our markers during the 2017 marking exercise, e-Marking Help Desk operated from 8:15AM to 10:00PM daily with the average resolution time being just under five (5) hours during the peak marking period. Again this session, twenty-five percent of the tickets resolved during the marking period related to Login Account or Password issues and could have had a negative impact on marking operations if they had not been resolved quickly.
Misconduct
13. There were eight cases of irregularities reported during the January 2018 exercise. In five cases candidates were caught with cellular phones in their possession in the examination room, one candidate was found with unauthorized material and there was one case of impersonation. The candidate found guilty of impersonation was disqualified and debarred while the other cases had their results in the affected subjects cancelled.
Results Summary
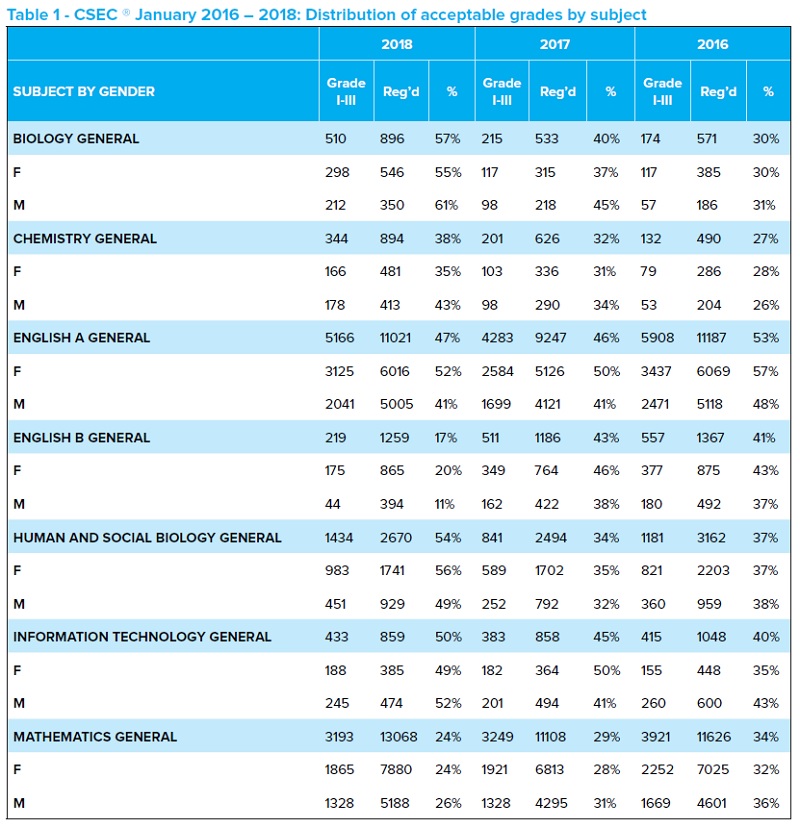
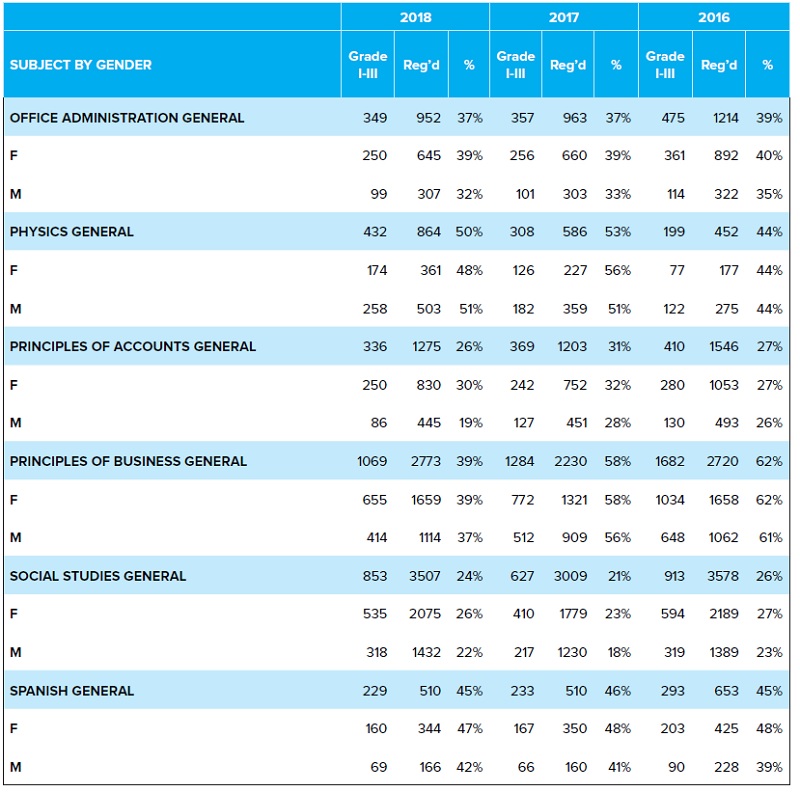
14. The table below shows the distribution of acceptable grades by subject and for the January 2016 - 2018 sessions. The detailed statistics and analysis can be found in the Statistical Bulletin.
MAY-JUNE 2018 EXAMINATION ADMINISTRATION
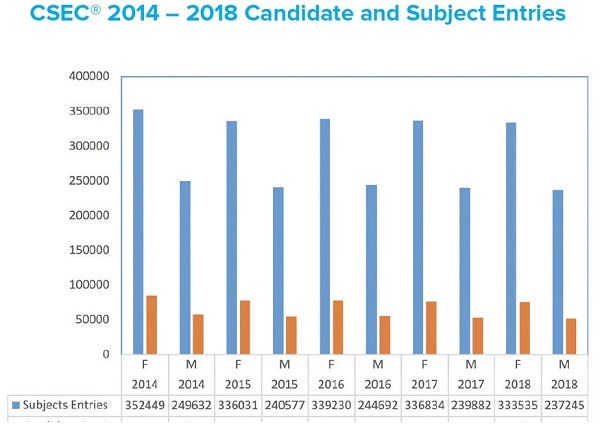
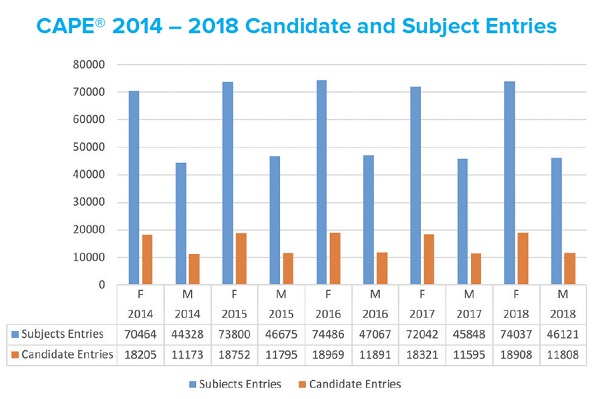
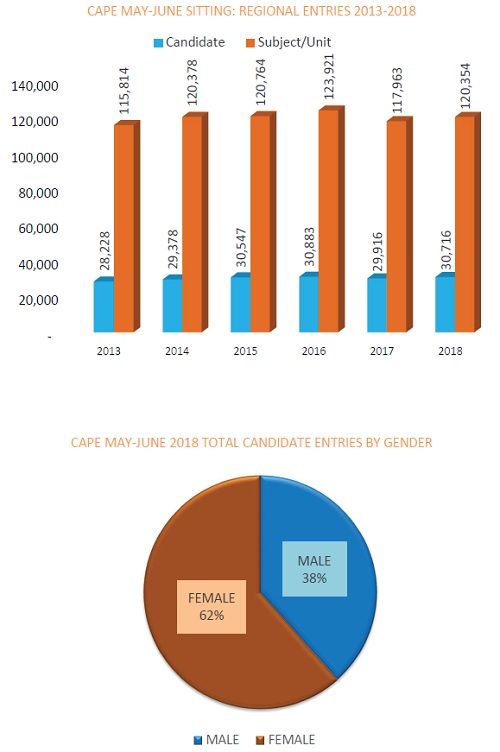
15. Figures 2 and 3 show the registration data for the May-June sessions over a five year period for CSEC® and CAPE®.
16. Figure 2 shows that the CSEC® entries were just over 1% lower than 2017 with the 5 year data showing a slowing downward trend. Though the total entries have not been increasing, the average number of subject taken per candidate has improved from 4.3 in 2014 to 4.6 in 2018.
17. Figure 3 shows the CAPE® data and a more positive picture than CSEC® with a 2.7% increase in candidate entries over 2017 and a slight upward trend over the 2014 – 2018 period. The average number of subjects per candidate remain at 3.9.
18. 
19. 
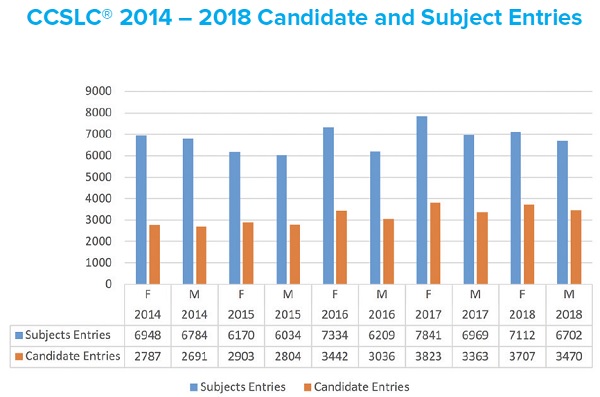
20. CCSLC® recorded significant growth between 2015 and 2017 as shown in Figure 4 but subject entries declined by 5.6% this year. Also noticeable was the steady decline in the number of subjects taken per candidate. Subjects per candidate that averaged 2.5 in 2014 has fallen to 1.96 in 2018.
Electronic Testing
21. In response to the severe damage caused to infrastructure by the passage of hurricanes last September, the British Virgin Islands (BVI) opted to do as many subjects as possible on the e-Testing platform this year. Though initially apprehensive, the team in the BVI was able to complete the session without any major incidents. Likewise, Anguilla, also affected by the passage of hurricanes last year, was able to mobilize lightweight, low-costs computing devices to ensure candidates could complete examinations even while national infrastructure was being rebuilt. The approach taken by these territories should be championed and incorporated in the resiliency strategies of the region.
22. In general, the e-Testing platform was more robust this session. The improvements in the candidate interface resulted in a much better overall user experiences. In addition to the full-online mode, the fully-offline option was again made available but was not utilized by any of our territories.
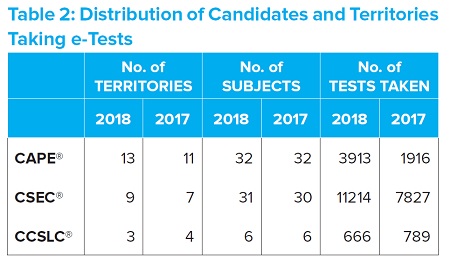
23. Table 2 shows the distribution of candidates and territories that participated in e-Testing this session. While there was a 50% increase over the 2017 May/June numbers, the number of candidates taking test electronically is still very small. Despite the reported easy of delivery, reduced costs of operation with the elimination of storage and shipping and the positive feedback from candidates, some territories have still not opted for e-Testing.
Marking Operations
24. The changes introduced to CSEC® English A (one less question), CSEC® English B (Paper 010 changed to MC) and CAPE® Literatures in English Unit1 and Unit2 (MC paper introduced), reduced the total marking workload this session.
25. In preparation for taking the moderation process for CSEC® Visual Arts and CAPE® Art and Design to the local centres, CXC provided moderator training across all territories this year. There was positive feedback from all concerned to the training and exposure. However, the post activity review revealed areas for improvement in some territories where greater capacity building is needed. We will continue to monitor the performance of the centres and consider the randomization of sampling as performances improve.
26. The new SBA marking method (Standardization, No Seeding and Chief Examiner Review); avoided the challenges faced last year with the downloading of the data and offered a much better marking experience overall. This method captured feedback at the candidate level (on-page comments function) versus the centre-level feedback that obtained previously. It also allowed more efficient capturing and distribution of feedback to centres. Unfortunately, the planned improvement to the e-SBA submission system was not completed on-schedule and rather than deploying a system that was not validated, we decided to delay the implementation by one year. Due to the system defects where samples submitted were overwritten within, several centres were asked to resubmit SBA samples and/or Cover Pages.
27. The scanning of scripts at Restore UK went relatively smoothly. The only noticeable impact of the change from the USA was the transit time that appeared to have increased. This matter is being further investigated since LRs also delayed shipments to achieve greater consolidation given the higher costs of shipping to the UK.
28. The challenges with Script Level Additional Objects (SLAOs), Packet Level Additional Objects (PLAOs) while reduced, still required significant manual effort. Despite reminders to LRs for onward instruction to centre supervisors, extraneous material was still sent to the scanning bureau. Given the added costs for processing this additional material (scanning or return shipment), consideration may have to be given to passing the additional costs unto those who continue to violate the instructions.
School Based Assessment
29. CSEC® School Based Assessment (SBA) continued to be submitted electronically in 2018. Many of the centres utilized the option of group work for the SBA and candidates worked in groups consisting of at least two persons and submitted one SBA project. On-site moderation was implemented for Visual Arts in 2018 with training of moderators conducted in 17 territories during the period April to June 2018. SBA was also introduced for English A, English B and Mathematics in 2018.
30. Agricultural Science, Biology, Chemistry, Industrial Technology, Music, Physics and Technical Drawing continued to be moderated on-site. Random Sampling was again conducted in the following subjects – Caribbean History, Principles of Accounts, Principles of Business and Technical Drawing.
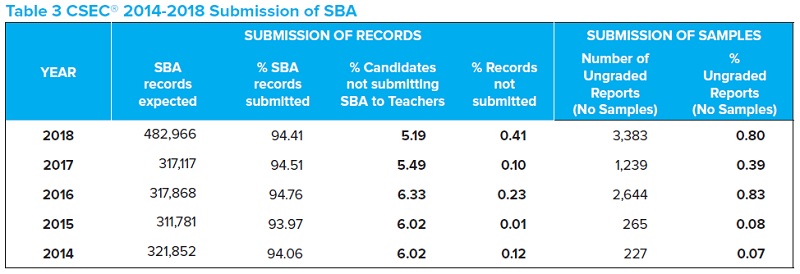
31. The number of candidate entries for SBA subjects was 482,966, a significant increase when compared with 317,117 in 2017. This is attributed to the introduction of the SBA for English A, English B and Mathematics this year. The percentage of SBA data records submitted was similar to that of 2017. Of the 482,966 CSEC® SBA records expected, 455,976 were submitted (94.41%), compared with 94.51 % in 2017. Some 26,990 SBA scores were not received by CXC at the 31 July cut-off date. Of this number, teachers’ reports suggest that 25,066 have not been submitted by candidates. This accounts for 5.19% of the candidate population.
32. Table 3 compares the submission of SBA records and SBA samples during the last five years.
The SBAs for 27 subjects (51 units) of the 35 CAPE® subjects were submitted online, while onsite moderation was conducted for 8 including Art and Design which was moderated onsite for the first time this year. In 2016 the Council formally promoted the submission of Group SBAs and this year several centres opted to submit their CAPE® SBAs using this option.
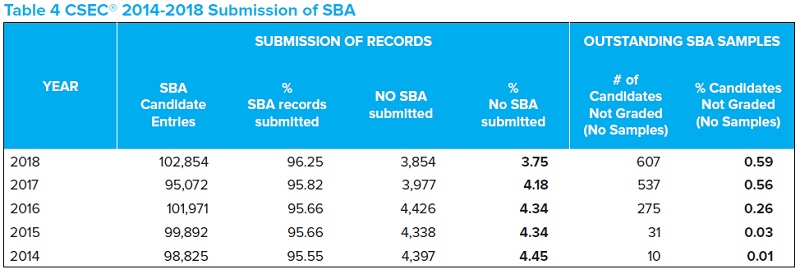
34. At the stipulated deadline of 31 May 2018, 98,923 (96.18%) of the 102,854 registrants submitted their SBA scores, compared to 95.87% in 2017, an improvement in submissions in 2018 by 0.31%. In 2018, the teachers reported that 3,854 (3.75%) of candidates did not submit their SBAs, while in 2017, 3,977 (4.01%) didn’t. This indicates a slight improvement in submissions for 2018 by (0.26%) when compared to 2017.
35. Table 4 compares the submissions of SBA records and samples over a five-year period.
Misconduct
36. The cases of misconduct were dominated by cell phone violations. This session there were 8 instances brought to the Council’s attention compared with 16 last year session. After reviewing the candidates’ statements, in accordance with regulation 7.1, results were cancelled in the affected subject. Other cases of misconduct and collusion were similarly dealt with and results in the affected subjects cancelled.
Results Summary
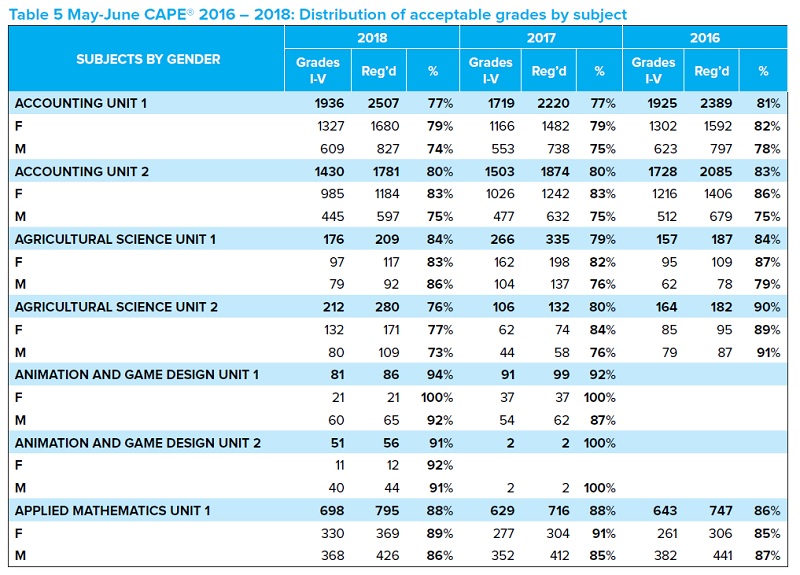
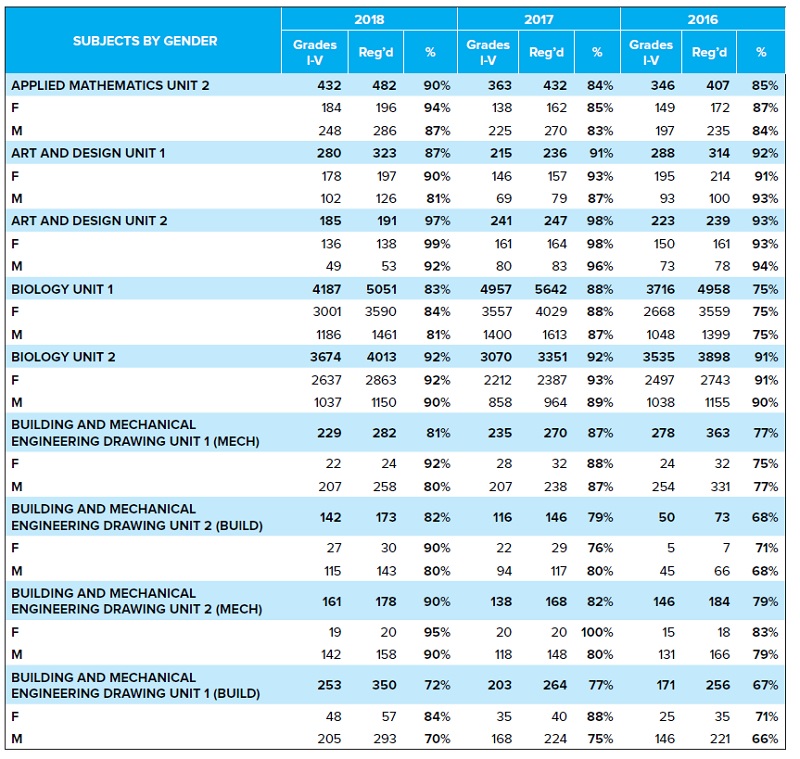
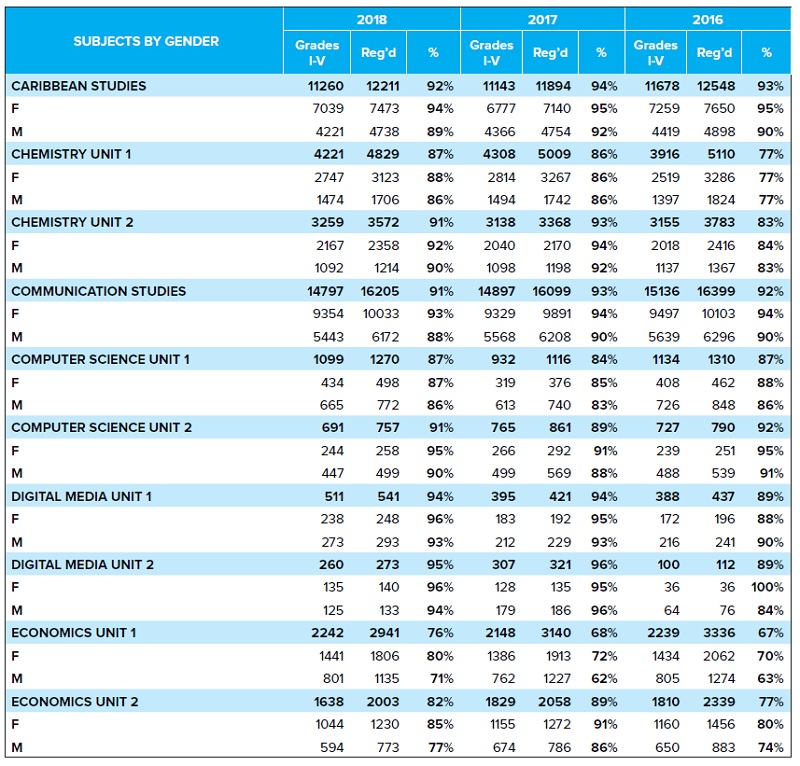
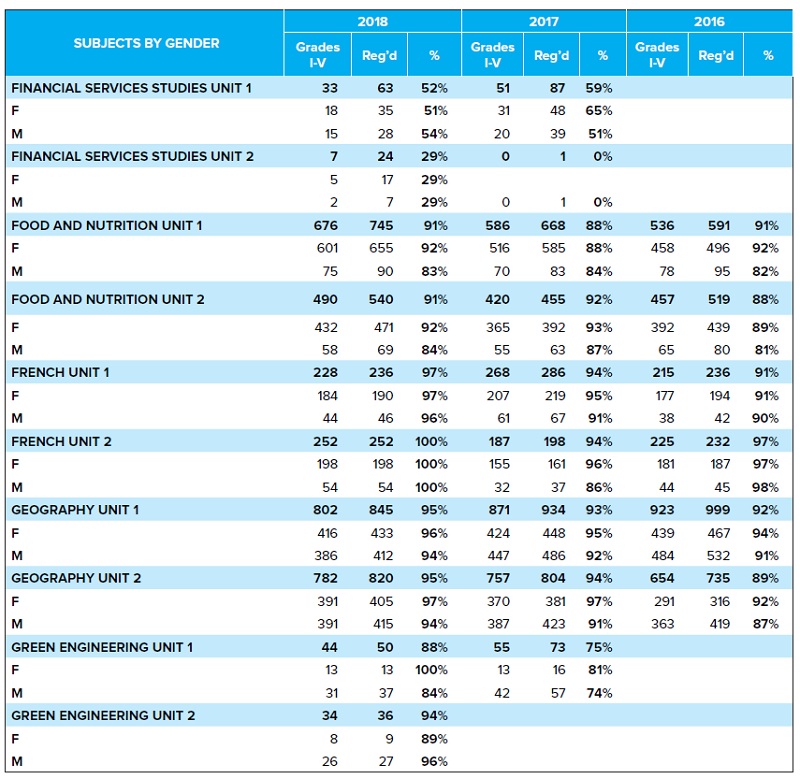
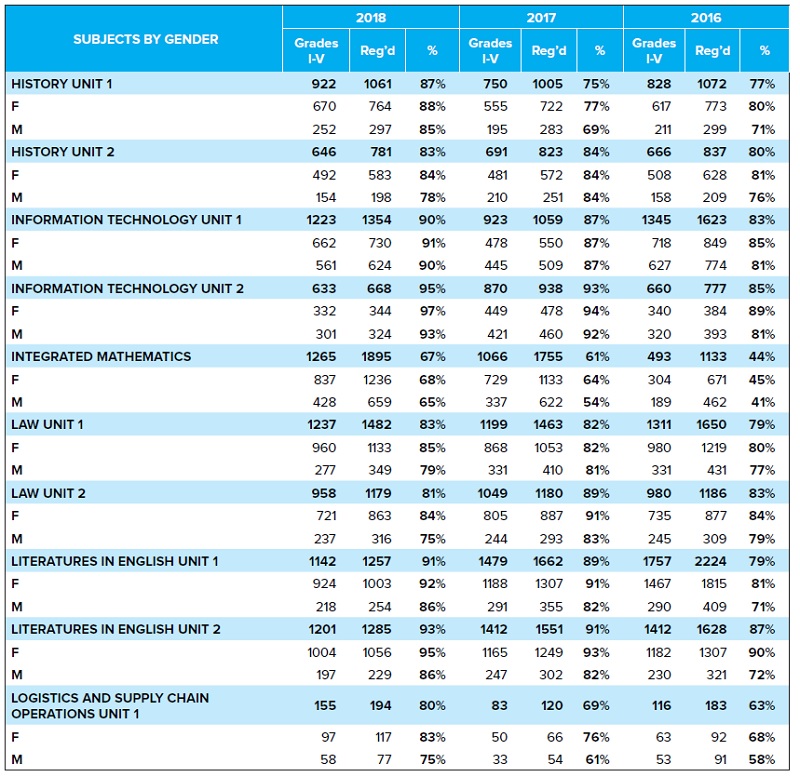
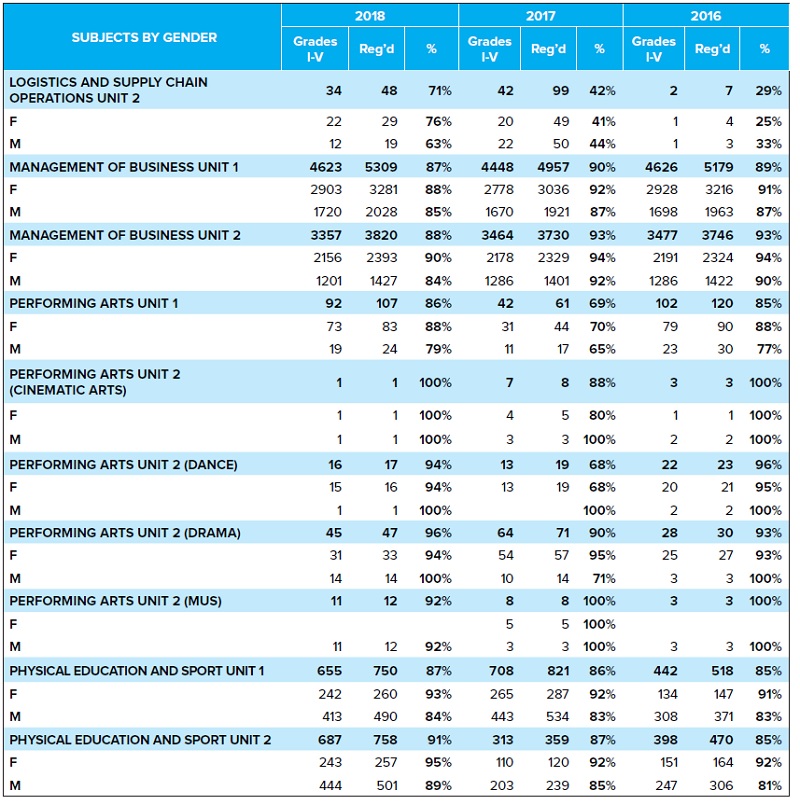
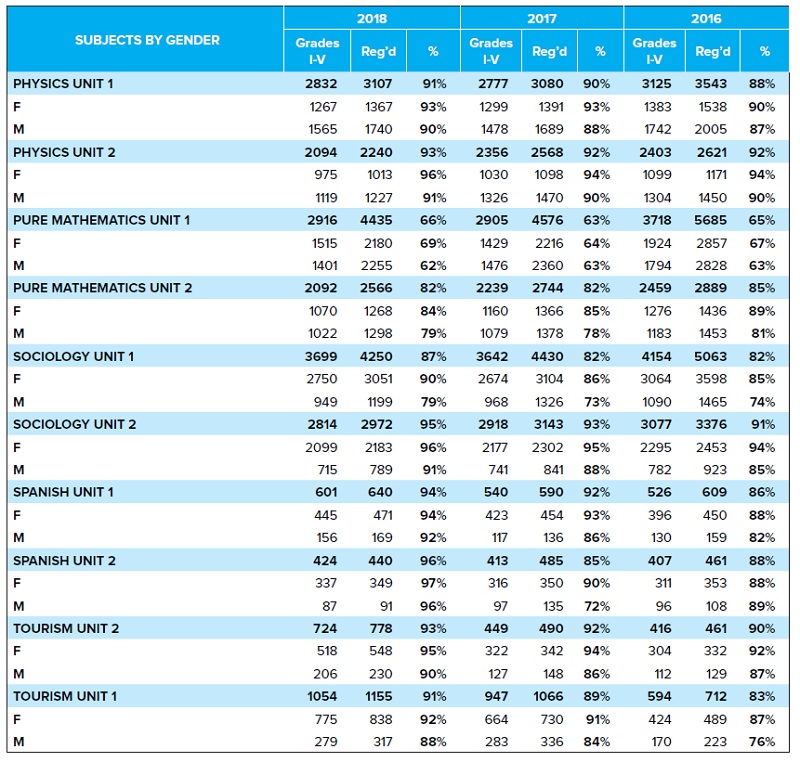
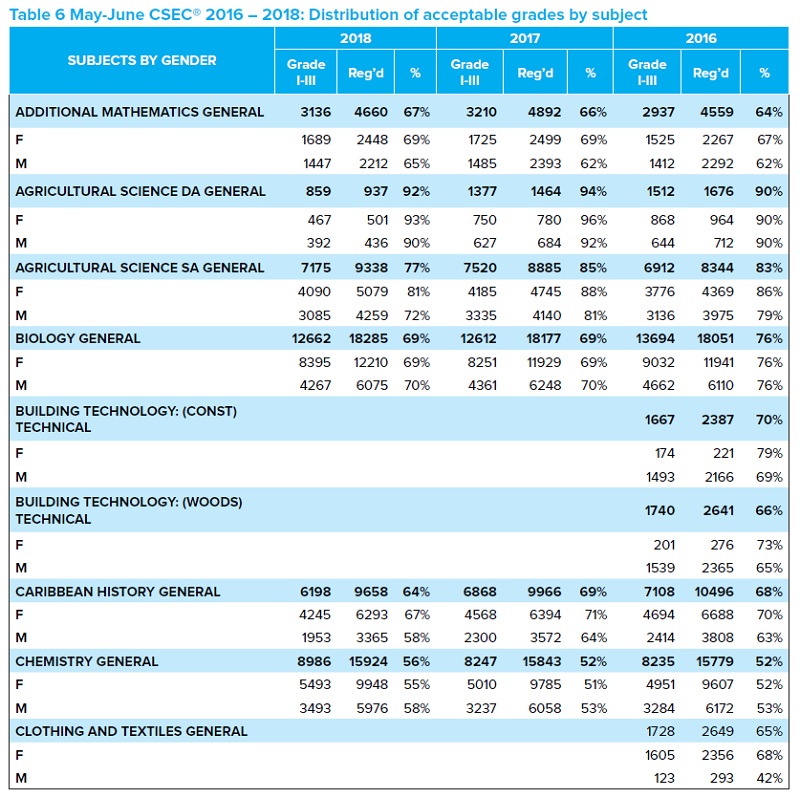
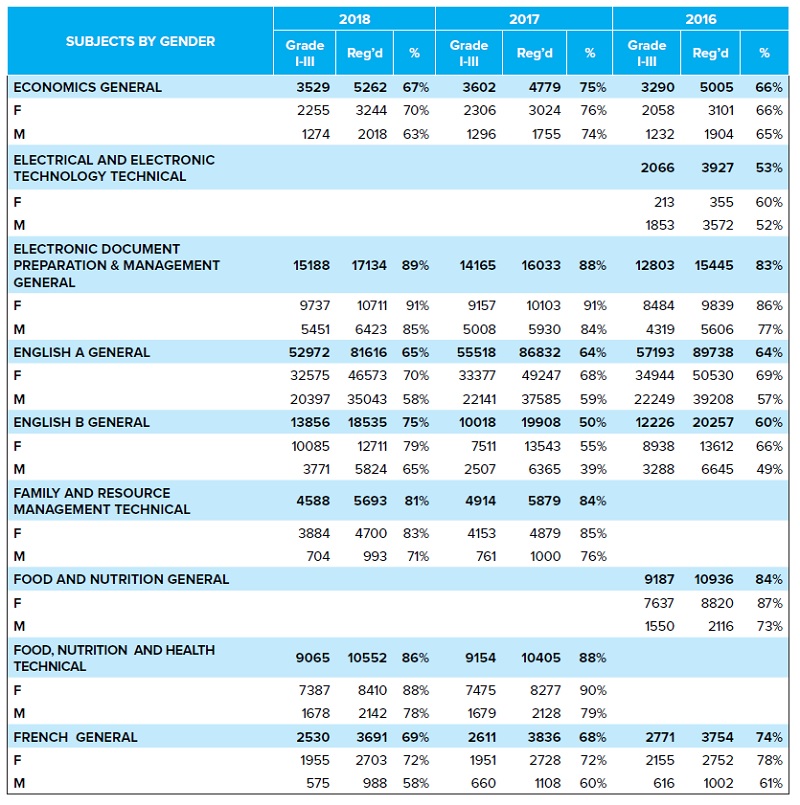
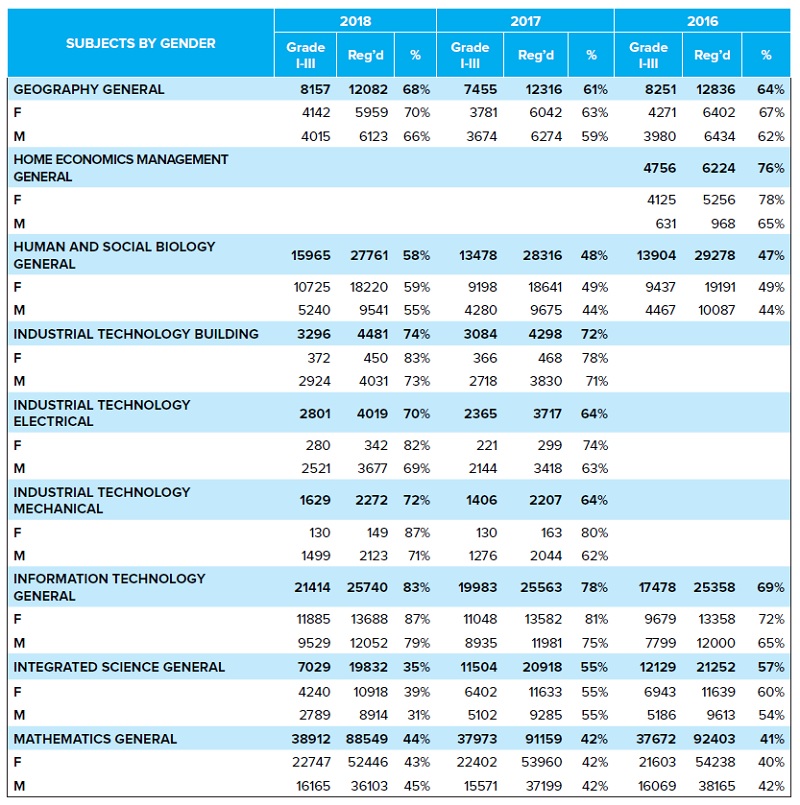
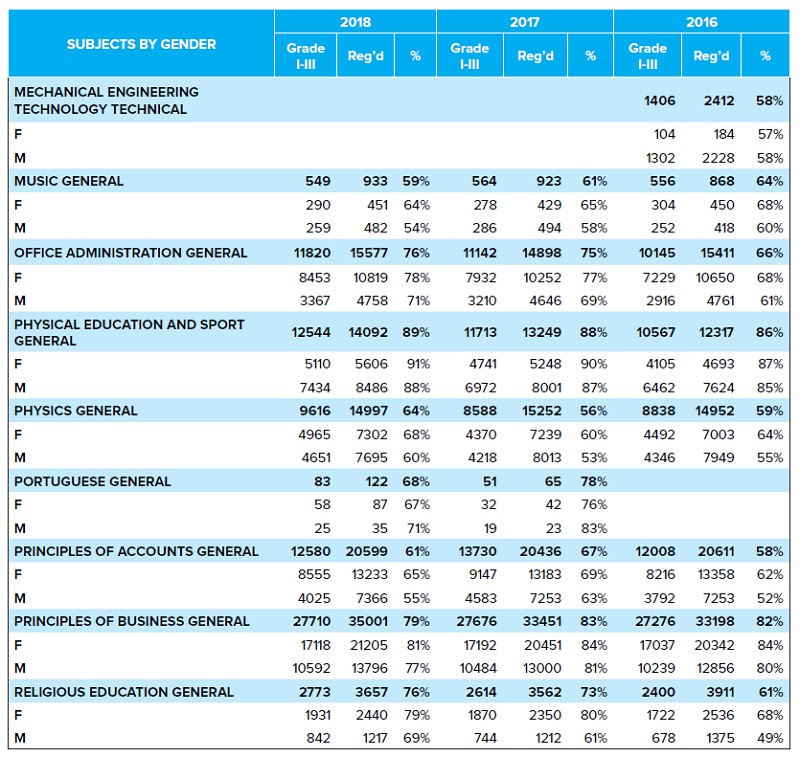
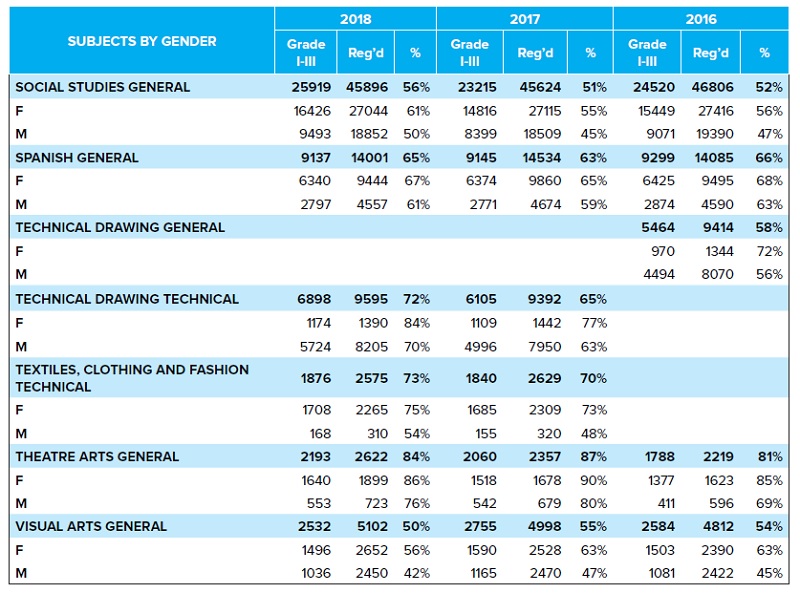
37. Tables 5 and 6 show the distribution of acceptable grades by subject and for CAPE® and CSEC® 2016 - 2018 sessions. The detailed statistics and analysis can be found in the Statistical Bulletin.

CCSLC®, CPEA™ and CVQ*
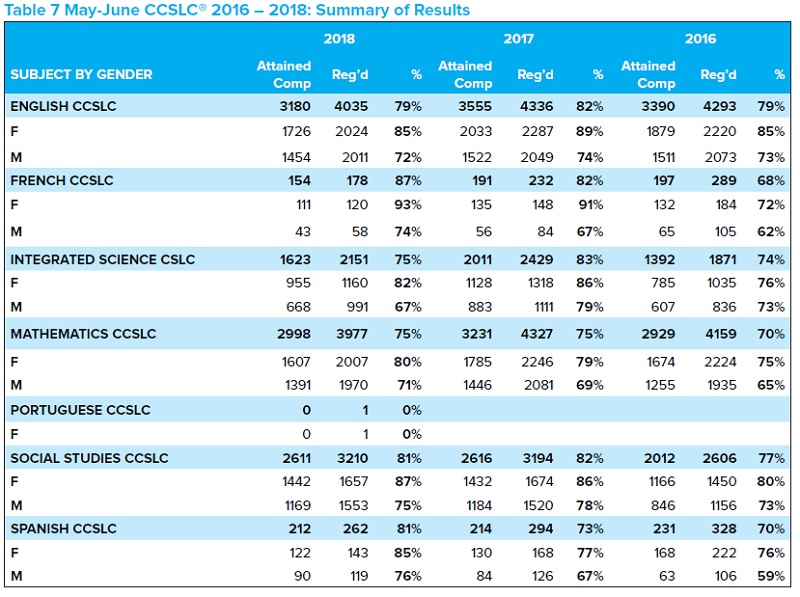
38. CCSLC®, CPEA® and CVQ* were processed and results delivered on schedule. Table 7 shows the CCSLC® summary results for 2016 – 2018.
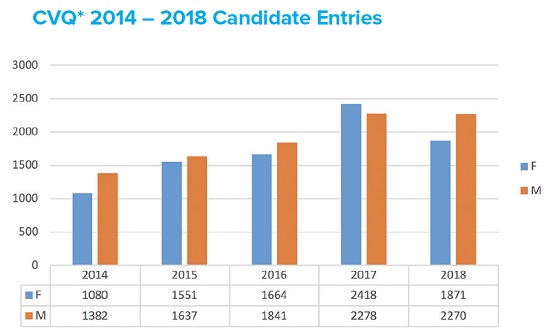
39. While there was a general upward trend over the five year period 2014 – 2018, the number of Candidates entered for CVQs in 2018 was 4,141, a 12% decline compared to 2017. Further, there was an even more significant 23% decline in the female population registering for CVQs this year. Figure 5 shows the comparison in candidate entries for 2014-2018.
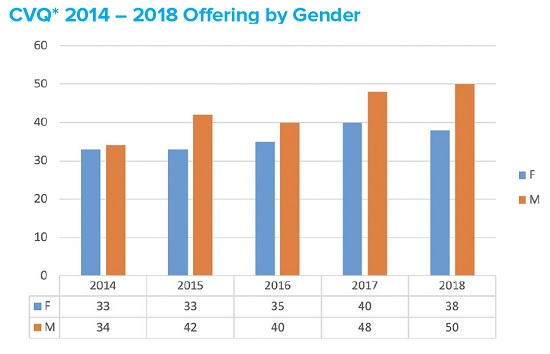
40. In examining the number of CVQs taken, there was a marginal increase of two for the males over the 2017 offerings, however, those offered by females were reduced to 38 from 40 in 2017. Figure 6 shows the comparison of CVQs offered by gender for 2014 – 2018.
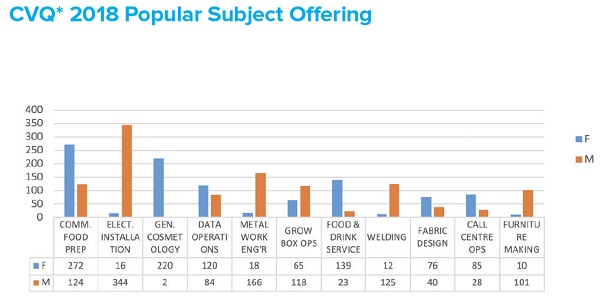
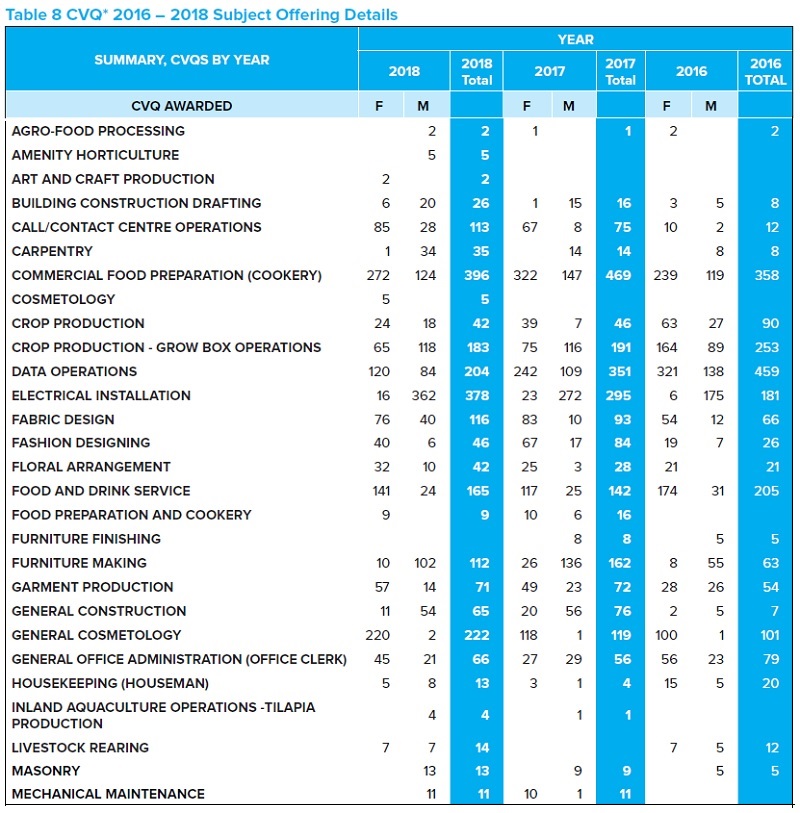
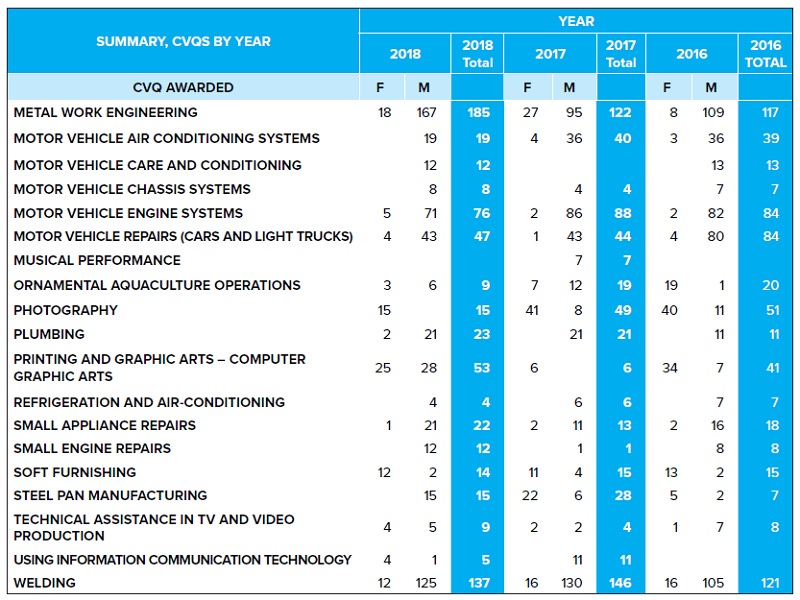
41. Figure 7 below shows the most popular CVQs completed in 2018. Commercial Food Preparation, Electrical Installation and General Cosmetology continue to be the leading qualifications issued. Also of note is the downward trend in Data Operations which was second only to Commercial Food Preparation in 2017 and the strong upward movement of Call Centre Operations. The details for all CVQs offered over the 2016 – 2018 period are shown in Table 8.
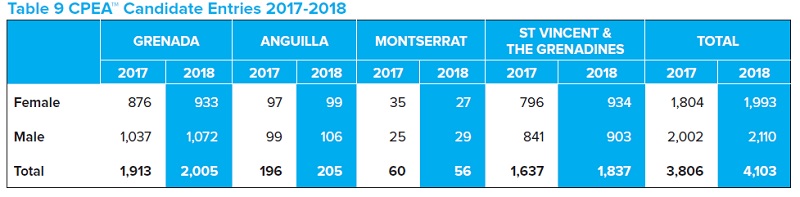
42. There was an overall increase of 7.8% in the CPEA™ candidate entries for the 2018 session with 4,103 candidates registered. Table 9 shows a comparison of the 2017 and 2018 candidate entries
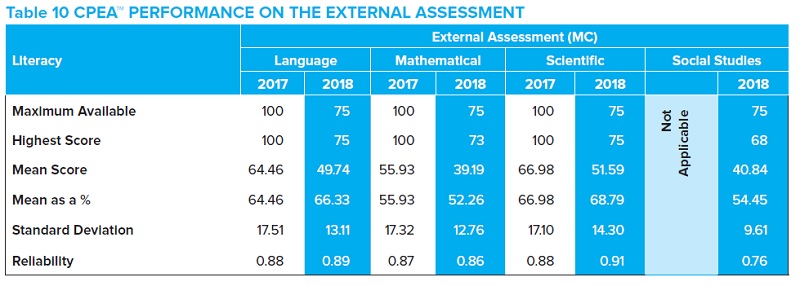
43. Overall, the means on the external assessment ranged from 52 per cent to 69 per cent of the maximum available score. Marginal improved performances were recorded on Language and Science with a decline in Mathematics. The reliabilities as measured by KR20 were above 0.85 for Mathematics, Language and Science. The lowest recorded was for Social Studies at 0.76. This indicates that, generally, each test was a good measure of the literacy it was designed to assess. Table 10 below shows the performance of candidates on the External Assessment (MC).
Conclusion
44. The Examinations Administration and Security Department had reasonable success in 2018. The Department administered all of the Council’s examinations without incident. The major sittings in January and May-June were delivered as timetabled and results published on schedule.
45. The thrust to improve operations through process reform and the use of appropriate technology continued throughout the year. To this end, application interfaces were developed to improve the data transfers between our registration applications, examinations processing system core databases and the testing platform. This allowed for greater efficiency and shorter processing cycles. These developments will position the department to better meet the needs for on-demand sessions. The monitoring processes were also reviewed and refined during the May-June marking and scoring operations.
46. The department continues to prepare for the adoption of e-Everything and has begun the re-tooling of staff and re-definition of functions. The thrust to improve customer services with more reliable marking, delivery of results and the servicing of transcript requests will continue in 2019.
|